

Most Bay Area restaurant owners check their social media the same way they check the weather — a quick glance at the follower count, a nod at the likes on last night’s post, and back to prepping the line. It feels like paying attention. It isn’t. The numbers that show up first are the ones that matter least, and the numbers that actually predict whether a stranger in the Marina turns into a Friday-night two-top are buried a few taps deeper than most owners ever look. If you’ve been posting consistently for months and still can’t say which posts filled tables and which just filled your feed, this is the piece that fixes that.
Analytics sound like a chore for someone with a marketing degree and too much time. They’re not. Reading your restaurant’s numbers is a fifteen-minute-a-week habit that tells you exactly what to cook, shoot, and post more of — and what to quietly stop wasting your evenings on. Here’s how to actually read them in 2026.
Your Follower Count Is Lying to You
Followers are the easiest number to grow and the least connected to revenue. A giveaway, a follow-for-follow spree, or one lucky viral Reel can add a few thousand accounts overnight, and almost none of them will ever walk through your door. We’ve seen Inner Sunset spots with 12,000 followers doing quieter Tuesdays than a Mission taqueria with 2,300 — because the taqueria’s followers are actual neighbors, and the big account’s followers are bots, contest-hunters, and people three states away who liked one photo of a crab.
What to look at instead is where your followers physically are. Both Instagram and Facebook show you the top cities and countries of the people following you, and this single screen is worth more than the follower total sitting above it. If you run a restaurant in SoMa and more than half your audience lives outside the Bay Area, your content is entertaining the internet rather than recruiting diners. That’s not a disaster — reach is reach — but it tells you to tilt harder toward local hooks, neighborhood tags, and the kind of “come in this week” language that only means something to someone who can actually get to Folsom Street by seven.
Saves and Shares: The Two Numbers That Actually Matter
A like is a reflex; a save is an intention. When someone taps the little bookmark on your post, they’re telling the algorithm — and telling you — that they want to come back to this. For a restaurant, a save almost always means “I want to eat this” or “I’m taking someone here.” It’s the closest thing social media gives you to a person writing your name on their to-do list. When we audit a new client’s account, saves per post is the first metric we pull, because it separates the food that looks good from the food that makes people hungry.
Shares are saves with a plus-one attached. A share means someone sent your post to a friend, a partner, or a group chat — which is exactly how dinner plans get made in the East Bay and on the Peninsula. One share to a six-person group text can be worth more than a hundred likes, because it puts your restaurant into a conversation that ends with a reservation. Track which dishes and which video hooks get shared, and you’ve found the posts worth repeating every single month. If your salt-and-pepper crab clip gets shared twelve times and your interior-decor post gets shared once, the crab is your marketing whether you meant it to be or not.
The practical move is to rank your last thirty posts by saves and shares, not likes. You’ll usually find the ranking looks nothing like you expected. That gap between what you thought performed and what actually did is the single most useful thing analytics will ever hand you.
Reach, Impressions, and Why the Difference Changes What You Post
Reach is how many people saw your post; impressions is how many times it was seen. They sound interchangeable and they aren’t. If a post has 4,000 reach and 9,000 impressions, plenty of people came back for a second and third look — a strong sign the content earned attention rather than just scrolling past it. For restaurants, high impressions relative to reach often means your food stopped the scroll, which is the whole game.
The number under reach that most owners ignore is the follower/non-follower split. Instagram tells you what percentage of your reach came from people who don’t follow you yet, and for a restaurant trying to grow in a specific pocket of the city — North Beach, the Outer Richmond, downtown San Mateo — that percentage is your discovery engine. When a post reaches mostly non-followers, it’s doing recruitment. When it reaches mostly existing followers, it’s doing retention. You need both, but if every post only reaches people who already know you, you’ll never fill the room with new faces, and it’s a cue to lean into Reels, trending audio, and location tags that travel beyond your current audience.
The Walk From Feed to Front Door
Profile visits are the moment curiosity becomes consideration. Someone liked a photo, then tapped your name to see who you are — that tap is a small but real signal of intent. Instagram shows you profile visits as a weekly number, and watching it move alongside your posting is one of the cleanest ways to tell whether your content is doing more than entertaining. A spike in profile visits after a particular Reel means that Reel sent people looking for your hours, your address, your menu. That’s a diner in motion.
Link taps and the “address” button are the last step before a table. Whether you send people to a reservation page, an online-ordering link, or a link-in-bio landing page, the tap count tells you how many people went looking for the door. If your reach is huge and your link taps are near zero, you have an attention problem disguised as a success — lots of eyeballs, no motion toward a booking. The fix is rarely more posting; it’s clearer calls to action and a bio that makes the next step obvious. A Peninsula bistro we worked with tripled its reservation-link taps in a month without changing its content at all — it just started actually telling people, in the caption, to tap and book.
Read Your Google Business Profile Like a Local
For a restaurant, Google Business Profile insights are arguably more honest than Instagram’s. Nobody scrolls Google Maps for fun. When someone searches “dim sum near me” from their phone in Daly City and lands on your profile, they have their shoes on. The two numbers to watch are direction requests and calls, because both are people trying to physically reach you or talk to you — there is no vanity version of “get directions.”
Pay attention to how people found you, too. Google splits your views into discovery searches (someone looked for a category, like “ramen in the Inner Sunset,” and found you) versus direct searches (they typed your name). A healthy, growing restaurant sees discovery searches climbing, because that means new people are stumbling onto you through category and neighborhood searches rather than only regulars looking you up. If your direct searches are strong but discovery is flat, your reputation is solid but your visibility isn’t — and that’s usually a photos-and-reviews problem, not a social-media one. The restaurants winning the “near me” search in the North Bay are the ones adding fresh photos weekly and answering every review, and their insights show it.
Build a Five-Minute Weekly Scorecard
Analytics only work if you check them on a rhythm, not in a panic. Once a week — we like Monday mornings before service ramps up — open a simple note or spreadsheet and write down six numbers: total reach, your best post by saves, your best post by shares, profile visits, link or address taps, and Google direction requests. That’s the whole scorecard. It takes five minutes and it turns a vague feeling of “I think Instagram is working” into a trend line you can actually steer by.
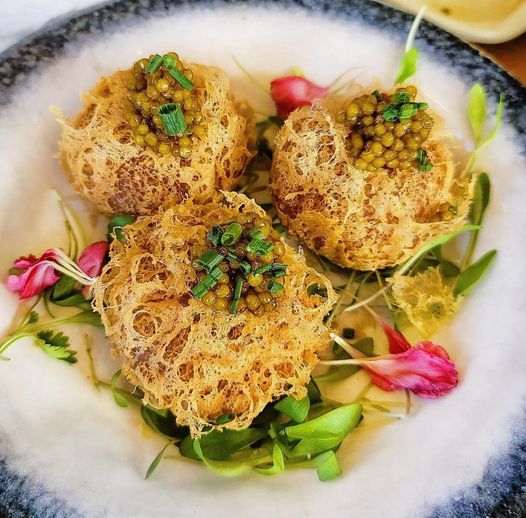
The magic isn’t in any single week; it’s in the comparison. After a month, you’ll see which weeks spiked and you’ll remember what you posted to cause it — the behind-the-line video, the caviar-topped taro puff shot, the “we’re open Labor Day” Story. That memory, backed by a number, is your content strategy writing itself. You stop guessing what your SoMa or Mission crowd wants and start reading it directly off the page. And when a week dips, you don’t spiral — you look at what changed, adjust, and move on.
What the Numbers Can’t Tell You
Analytics measure attention and intent, not the whole business. They can’t see the regular who found you on Instagram eighteen months ago and now comes in every Thursday without ever tapping a link. They can’t count the couple who screenshotted your menu instead of saving the post, or the group that talked about your patio at brunch and booked a week later by phone. Social media’s effect on a restaurant is real but laggy and messy, and if you demand a clean click-to-cover attribution for every dollar, you’ll drive yourself crazy and probably quit posting the exact content that’s quietly working.
So use the numbers as a compass, not a scoreboard. Let saves and shares tell you what food to feature, let reach and profile visits tell you whether you’re growing or just maintaining, and let Google’s direction requests remind you that the whole point is a body in a chair. Then trust your eyes and your dining room for everything the dashboard can’t capture. The best-run restaurant accounts in the Bay Area aren’t the ones obsessing over every metric — they’re the ones checking the right six numbers weekly and spending the rest of their energy on the food and the room.
If reading your own analytics still feels like squinting at a foreign language — or if you’d simply rather spend your fifteen minutes on the line instead of in the dashboard — that’s exactly the kind of thing we handle for Bay Area restaurants every day. At Metaroots, we run the content, watch the numbers, and translate them into a plan that actually fills tables, so you can get back to running the place. Get in touch with us here and let’s take a look at what your numbers are trying to tell you.